Examples
Spot core papers describing a field as shown below:
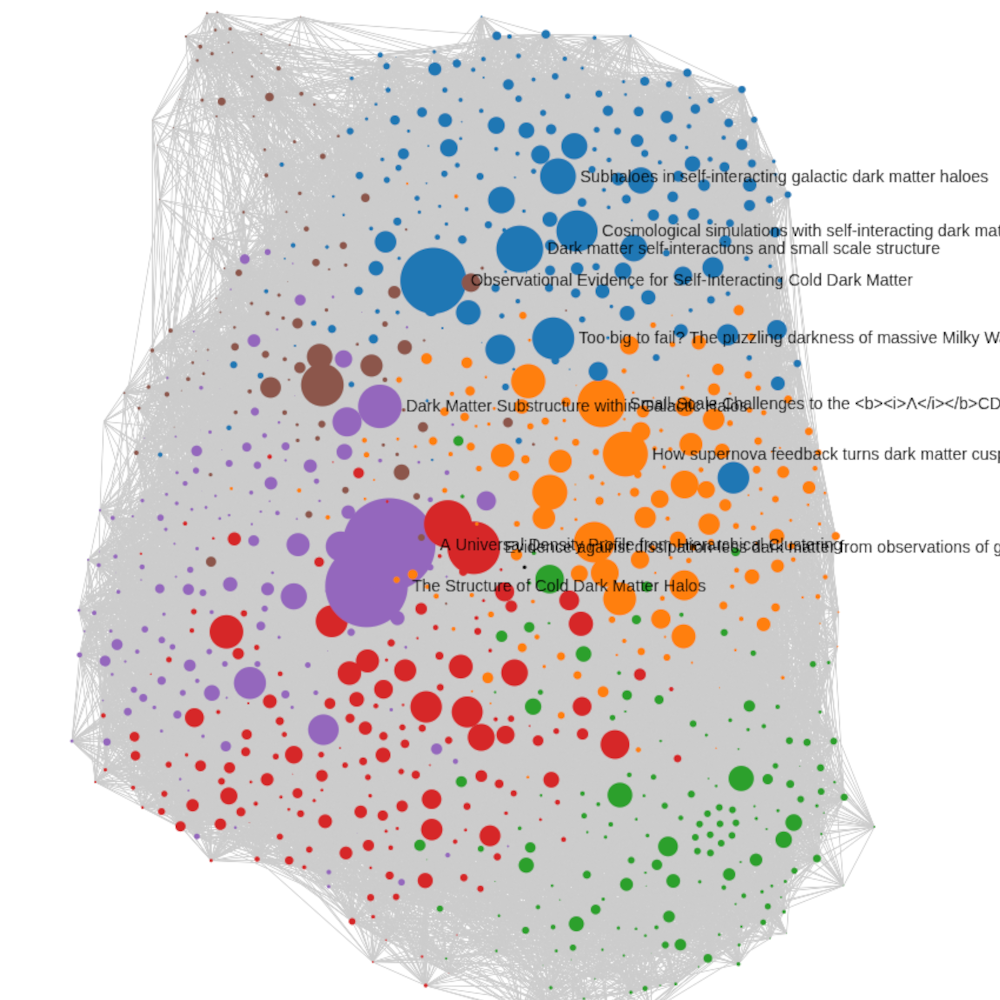
Galactic Dark Matter
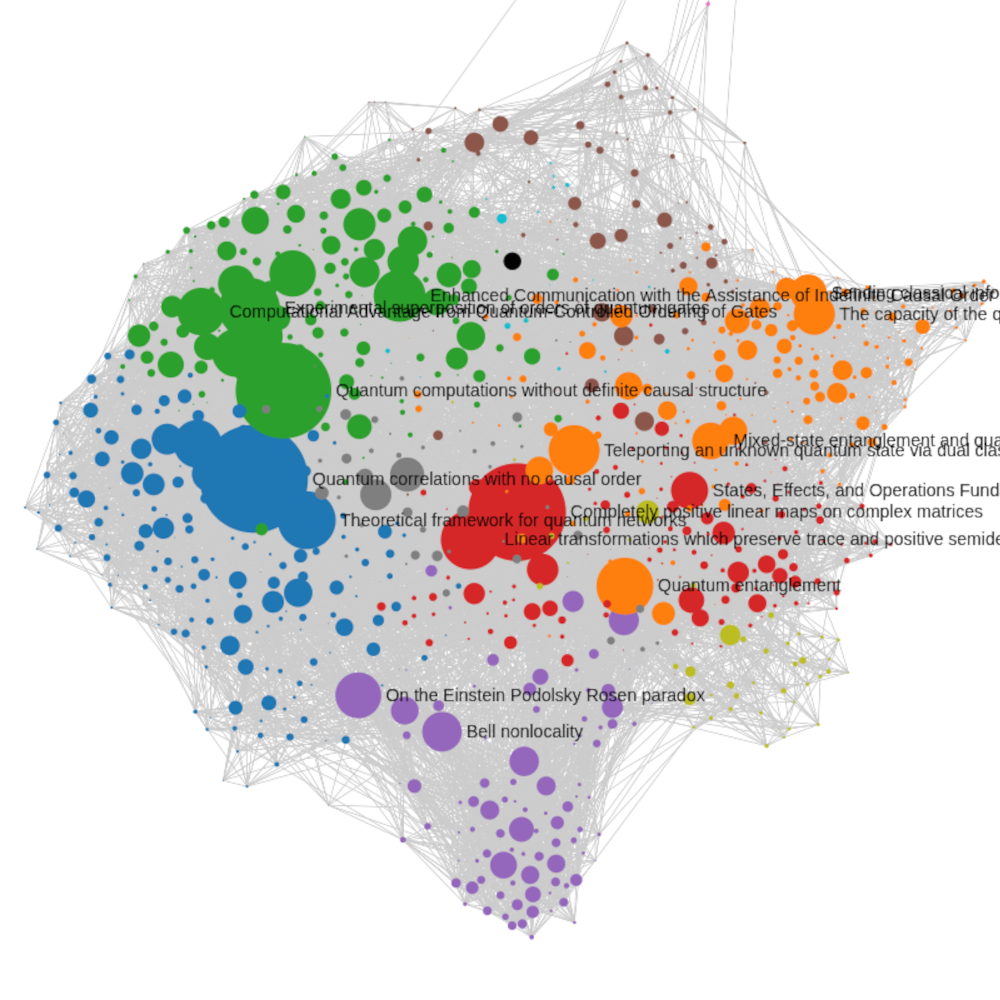
Quantum Causality
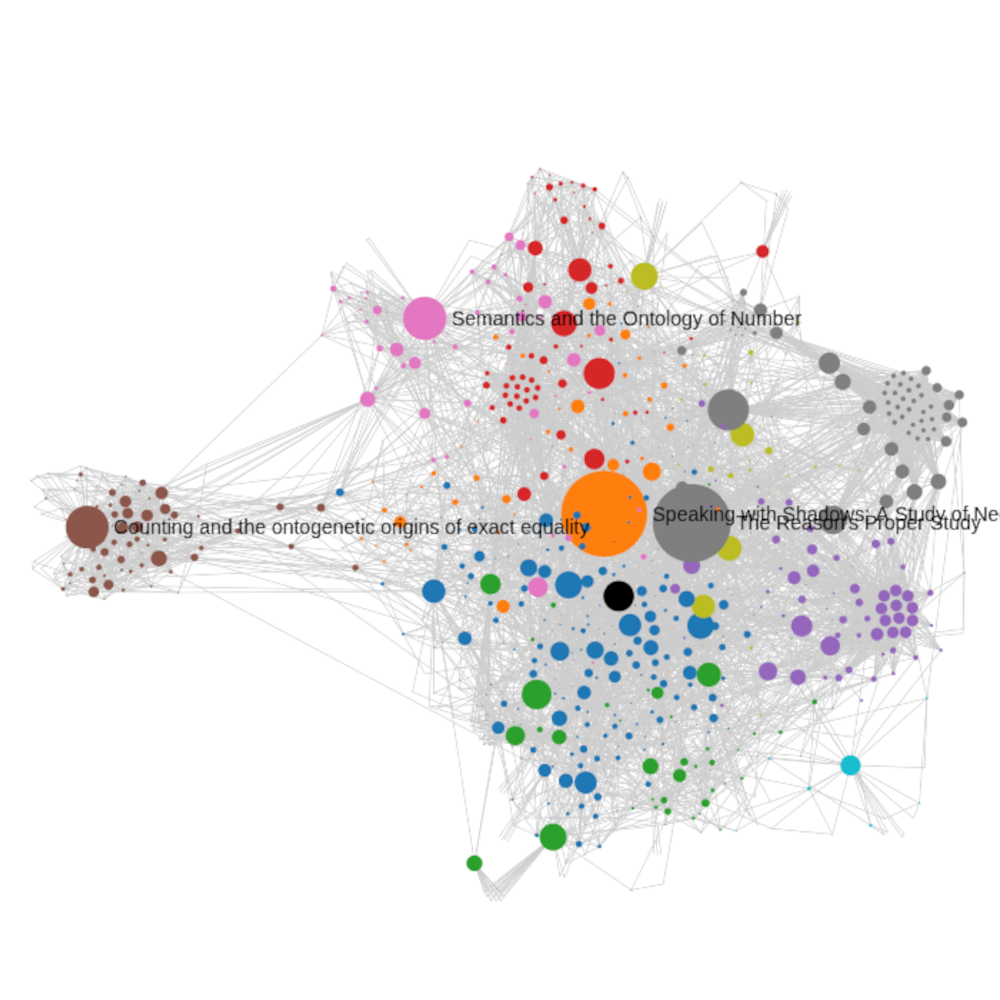
Hume's Principle
Enter a list of dois or a bibtex content.
Spot core papers describing a field as shown below:
Galactic Dark Matter
Quantum Causality
Hume's Principle